Have you ever gone to the supermarket in search of your favourite product, only to find that it’s out of stock? Frustrating, right? That’s exactly how your customers feel when you’re unable to fulfil their orders due to a low fill rate. Learn here what is fill rate is, how to measure it and how to increase it. Don’t let your customers down, keep reading here to learn everything about Fill Rate.
What is Fill Rate in Supply Chain
If there would be only one KPI to pick in the supply chain that would be the Fill Rate.
This is a key element to understanding how good or how bad the supply chain is doing.
Why? It is directly impacting the happiness of your customers.
High Fill Rate –> happy customers. The same applies in the opposite way.
Let’s see in detail what Fill Rate is about.
By the way – KPI – stands for Key Performance Indicator.
Discover the most important supply chain acronyms.
Definition of Fill Rate in Supply Chain
Fill Rate (also known as FR, Order Fulfillment or Service) is the level (in percentage) of an order you can fulfil from the stock you have on hand. This is the key indicator in the Supply Chain to define how good (or bad) your organization is capable the fulfil the needs of your customers.
The higher the Fill Rate you can fulfil, the more profit your supply chain will contribute to the P&L of the organization.
To put it simple,
Fill Rate is how much you are able to ship versus the total that was ordered, let’s see in detail the formula to calculate the Fill Rate with an example.
Formula of Fill Rate
The fill Rate can be easily calculated by dividing the number of items shipped by the total number of items ordered and multiplying the result by 100.

The Fill Rate is normally calculated as a percentage, and the standard industry locates the ideal target between 95-98%.
Step by step on how to calculate Fill Rate
Step #1
Identify how many items your customer ordered
No matter how you get the orders from your customer,
it can be via Excel, email, online platforms…
no matter, all it starts with how you receive the order you will get a total number of items.
Step #2
Identify how many items you can deliver out of the total order.
Step #3
Calculate your Fill Rate by dividing the number of items to be shipped by the number of items to be ordered and multiplying by 100

You can do this easily in Excel – see this example:

Another option (a faster one) is calculating the Fill Rate using a VBA Excel Macro tool.
If you want to save time, in your Excel calculations without any previous programming experience,
learn how to program an Excel Macro using Artificial Intelligence.
Types of Fill Rate
In pure supply chain, the main Fill Rate that is measured, it is the Fill Rate in items,
however there are other Fill Rate measures that are important to know.
Items Fill Rate
As mentioned, the Items Fill Rate is the most common Fill Rate and can be easily calculated by dividing the number of items shipped by the amount of items ordered

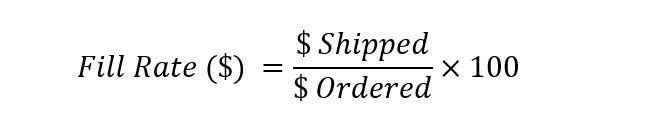
Dollar Fill Rate
In Finance, all is about money , for that reason there is the Dollar Fill Rate.
Logic is very much the same as for Items, changing the Items into dollars.
One important element is that the Fill Rate in $ may not match the Fill Rate in Items.
Think about a case when you get an order for one item with very high $$$ value, and order for many items for very low items.
Seeing this example below, you can have Fill Rate of 99.9% in Items, and a Fill Rate of 48.7% in Dollars.
Once again – when in the order you have products with big price difference, the Fill Rate in Items may not match the Fill Rate in Dollars

Fill Rate on Time
Fill Rate on Time, also called as FROT, is the combination of two elements.
- FR – Fill Rate
- OT – On time
Fill Rate element, meaning how much of the items that were ordered were shipped.
On Time element, meaning how much of the items delivered, were shipped on the aligned timing with the customer.
Normally when a customer is placing an order, there is an estimation of time when a customer expects to receive the order.
If order is shipped within the expected timing, there would not be any OT impact, however if the order is delivered outside the expected timing, there would be a negative in the On Time element.
What is the difference between FR and FROT?
The main difference between FR (Fill Rate) and FROT (Fill Rate on Time) is the time element.
The FR does not “care” about the moment when the order is closed, it is pure comparison of how much is shipped versus what the customer order.
While the FROT “cares” about both, how much we can ship and if the order was fulfilled or not on time.
The high performing organizations such as: Amazon, Procter & Gamble, tend to have a big focus on both the FR and the FROT as it is directly impacting their profit and consequently the satisfaction of their final consumers.
How to increase Fill Rate without investing more money
Increasing the Fill Rate is one of the most common elements of focus for most of the supply chain organizations.
Why is that? The higher the Fill Rate, the more money you make out of every order, and consequently the more profit you make as organization.
When companies want to make a step change in their Fill Rate – they try to intervene on:
- Increase of inventory (Increase of storing space)
- Increase of production lines (Increase of staffing)
- Increase of Safety Stock (Increase of storing space)
All these interventions certainly will support reaching higher Fill Rates; however, they will come with a big investment of money that in many cases may not compensate the increase in Service.
If you want to increase your Fill Rate without investing more money, your major focus as organization should be working on the forecast accuracy.
The better the forecast, the more accurate the signals sent down the chain, and the higher the changes to fulfill the orders with a higher Fill Rate.
How increase the forecast accuracy?
One simple way to increase the forecast accuracy is in a certain time basis (for example monthly), root cause the top 10 products with over forecasting trend, and the top 10 products with under forecasting trend.
Once you are clear on the reason, review the forecast for the next 3 months and monitor how your service is increasing thanks to a more accurate forecast.
How to perform a root cause analysis.
Why do companies not target for a 100% Fill Rate?
Reality is companies intentionally do not target to reach the 100% Fill Rate in their service.
In fact, they target to reach slightly below, locating the sweet spot in terms of Fill Rate target somewhere in the range between 95-98%.
The higher the Fill Rate, the higher the satisfaction from the customer
Having that principle in mind and if service is directly impacting the customer satisfaction,
you may be wonder why companies do not target to reach a fill rate of 100%.
Even though 100% Fill Rate is great for customer satisfaction, the effort needed by the companies to reach such level it is not wort its money wise.
Trying to reach a service of 100% normally means investing a huge amount of money that it is not paying off in terms of profit.
The way of increasing your service is by investing on the key elements contributing to it:
- Increase of inventory
- Increase of storing space
- Increase of production lines
- Increase of Safety Stock.
All these increases can only be done by investing a huge amount of money into the supply chain.
Most of the cases this amount of money invested is not wort it versus the profit you can reach by increase 2-3 percentage points versus your target of 95-98%.
To summarize, companies do not target to reach 100% service, most of the companies try to move in the range between 85-95% with the top performing organizations in the levels of the 95-98%.
Conclusion of Fill Rate in Supply Chain
If there is one key KPI to focus on Supply Chain – no doubt: Fill Rate.
Fill Rate directly impacts the customer satisfaction and the profit of the company.
Key element contributing to a high Fill Rate is stock availability and this can only be achieved by a goof forecast accuracy.
FAQ questions Fill Rate in Supply Chain
Some of the questions more often asked regarding Fill Rate in Supply Chain
What is the acronym for Fill Rate?
The most common acronym used in Supply Chain for Fill Rate is FR, some people refer to Fill Rate as Service, Order fulfillment… all this represent the same idea. How much items you are able to fulfill versus the total amount of items that are being ordered.
How do you calculate Fill Rate?
Calculating Fill Rate is very simple, you need to divide the total amount of items that you are able to ship by the total amount of items that were ordered and multiply by 100. For example if a customer placed an order for o
What is rate filling?
Rate filling is how much of the total amount of items ordered by a customer you can deliver. You can calculate by dividing the amount of items shipped by the amount of items ordered and multiply by 100. Normally the fill rate is provided in a percentage.
What does it mean when a product fill rate is 80%?
When a product has a fill rate of 80% , means out of 100 products your customer is ordering , you are able to deliver only 80. To put some reference best companies in industry target to have a fill rate in the range between 95-98%
Is it possible to reach a 100% continuously?
Theoretically yes, however this is difficult to sustain in the long run due to big amount of money needed to ensure your organization can continuously deliver each order with a service of a 100%. Normally for high performing organizations the standard is to move somewhere between the 95-98% service.
What is the ideal target for fill rate?
It depends on many things. The product, the business, and the industry. However for some reference the high performance organizations tend to have to have a Fill Rate between 95 and 98%